


Severn Contact Tank
Client: NMC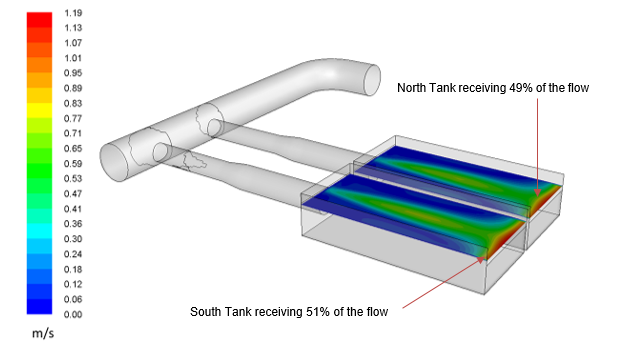

Scale: N/A
The analysis considered three contact tank arrangements;
- Current contact tank arrangement.
- Phase One Development – Twin inlet pipes, existing inlet baffle arrangement with new curtain walls.
- Phase Two Development – New manifold system within the tank with twin dedicated inlet pipes feeding each tank with new curtain walls. Existing inlet baffle arrangement abandoned.
- Phase Three Development – Twin inlet pipes, existing inlet baffle arrangement with extended curtain walls.
Analysis of the current contact tank arrangement
The CFD analysis established the contact tanks current performance for the future flow of 220 MLD when both the North and South Tanks are in operation and during a maintenance condition when only one tank will be in use at a reduced inflow of 110 MLD. Analysis of the current arrangement was undertaken with a total volume for two tanks of 5871 m3 which takes into account the additional volume generated by the head developed on the outlet weir at inflows of 220 MLD. Under a maintenance condition only the north Tank was studied with a volume 2949 m3. The outlet weir in both the North and South tanks was set at the current weir elevation of 172.98 mAOD with the weir crest set 0.107 m above the structural weir wall to represent the Ebonite weir plate.
The CFD modelling also established the flow split between each cell of the tank at 220 MLD using actual apertures and penstock openings in the inlet channel. The results have shown a 51% to 49% flow split in the South and North cells of the contact tank respectively and give a satisfactory apportioning of the total flow in the tank.
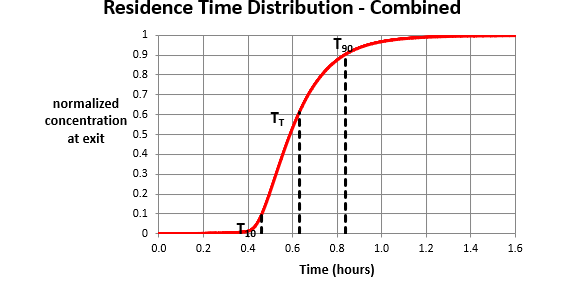
Ratios that indicate tank hydraulic efficiency are BF (Baffle Factor) and MI (Morrill Index). A tank having ideal plug flow would have a BF of 1.0, whereas a tank with a BF of 0.1 would be prone to significant short circuiting.The Morrill Index (MI) is indicative of the level of mixing and the presence of recirculation zones. The MI value must always be lower than 2 if a plug flow system is required.
The tables below show the results of the simulations for inflows of 220 MLD and 110 MLD respectively with the current inlet arrangement and assuming a 50% split in flows to the two cells. In the case of the maintenance condition, only the North Tank was studied.
|
North and South Basins - Flow 220 MLD – Tracer released at channel inlet – volume analyzed 5871 m3 |
||||
|
TTDT (hours) |
T10 (hours) |
T90 (hours) |
Baffle factor (BF) |
Morrill Index (MI) |
|
0.64 |
0.31 |
1.00 |
0.49 |
3.18 |
|
North Basin - Flow 110 MLD – Tracer released at channel inlet – volume analyzed 2949 m3 |
||||
|
TTDT (hours) |
T10 (hours) |
T90 (hours) |
Baffle factor (BF) |
Morrill Index (MI) |
|
0.64 |
0.39 |
0.93 |
0.62 |
2.36 |
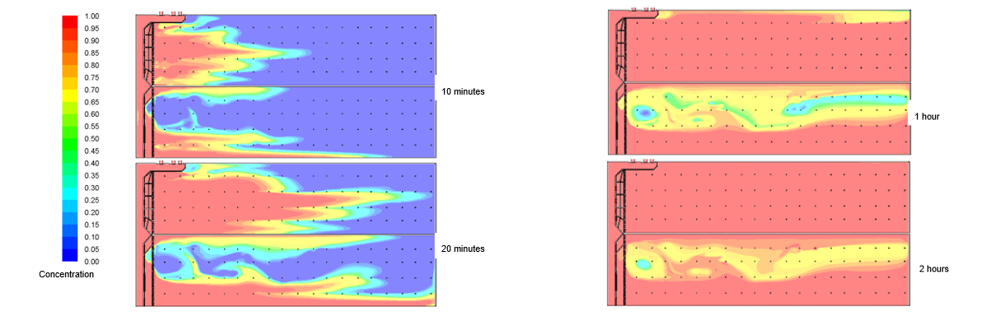
Observations made with streakline plots and tracer concentrations indicate that both tanks were subjected to short circuiting of flow with extensive recirculation zones present. The values for both the Baffle Factor and Morrill Index were indicative of poor hydraulic efficiency.
In addition the CT value was determined. The CT value demonstrates that the required disinfection is being achieved to kill any pathogens that may be carried through the water treatment plant. In this instance the clients specification calls for a CT of at least 40 mg min/l or better at 1.8 mg/l CI concentration. A CT value of 33.9 mg min/I was calculated at a flow of 220 MLD.
Phase One Development
Under the Phase One development option the manifold would be constructed outside the tank with two new inlet pipes entering through the West wall. The inlet pipes would deliver flow into the existing inlet channel and upstream of the existing inlet baffle arrangement which would be retained. To reduce short circuiting within the contact tank, curtain walls will be introduced running alongside the existing roof support columns to form a labyrinth style arrangement running horizontally along the length of each tank.
The model was run at a flow of 220 MLD with the hydraulic efficiency determined, see the table below.
|
North and South Basins - Flow 220 MLD – Tracer released at channel inlet – volume analyzed 5805 m3 |
||||
|
TTDT (hours) |
T10 (hours) |
T90 (hours) |
Baffle factor (BF) |
Morrill Index (MI) |
|
0.63 |
0.45 |
0.86 |
0.70 |
1.91 |
The analysis has shown that the proposed arrangement would provide good hydraulic efficiency at an inflow of 220 MLD. Industry guide lines as to effective contact tank performance, references Walkerton Clean Water Centre (WCWC) and Unit Process in Drinking Water Journal, state in respect of the BF and MI values respectively that;
Baffle Factor – Where a BF of 0.70 can be achieved by the introduction of labyrinth style baffles, the performance can be classed as superior. In the case of the Severn Contact Tank with the Phase One development arrangement installed a BF value of 0.70 was being achieved.
Morrill Index – The Morrill Index equals the ratio of the times for 90% and 10% of the tracer to pass. In perfect plug flow reactors, T90 / T10 equals unity. The MI value must always be lower than 2 if a plug flow system is required. In the case of the Phase One development arrangement, MI value of 1.91 was being achieved.
In addition the CT value was determined. A CT value of 47.6 was calculated for an inflow of 220 MLD.
Phase Two Development
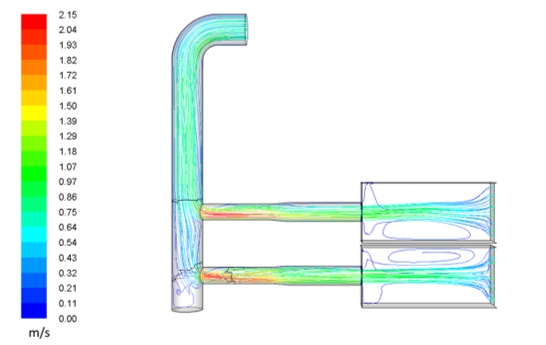
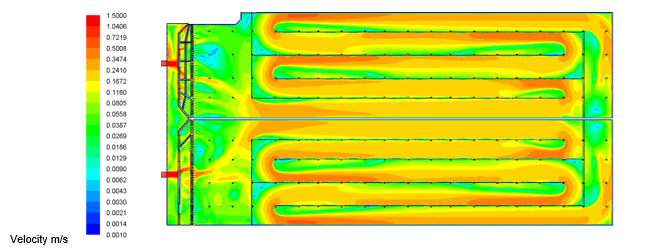
Phase Two development considered a new inlet pipe arrangement with dedicated inlet pipes feeding each tank. To reduce short circuiting of flow a series of curtain walls will be introduced into the contact tank to form five lanes running horizontally along the length of each tank.
Under the proposed contact tank arrangement the two tanks would operate independently from one another. As such the analysis only needed to study one tank in operation. To determine the flow split between the two tanks a sub-model of the inlet pipe arrangement local to the twin feed branches was built. The sub-model showed that the South tank received 51% of the flow with the North tank receiving 49%. As the South tank received slightly more flow this was used as a basis for the analysis.
The model was re-run for inflows of 175 MLD and 220 MLD, two tanks in service, with the hydraulic efficiency determined in the South tank only. The tables below show the results.
|
South Basin – Total inflow 175 MLD – Tracer released at the channel inlet – volume analyzed (manifold and tank) 2475 m3 |
||||
|
TTDT (hours) |
T10 (hours) |
T90 (hours) |
Baffle factor (BF) |
Morrill Index (MI) |
|
0.67 |
0.46 |
0.94 |
0.68 |
2.04 |
|
South Basin – Total inflow 220 MLD – Tracer released at the channel inlet – volume analyzed (manifold and tank) 2498 m3 |
||||
|
TTDT (hours) |
T10 (hours) |
T90 (hours) |
Baffle factor (BF) |
Morrill Index (MI) |
|
0.53 |
0.34 |
0.77 |
0.64 |
2.26 |
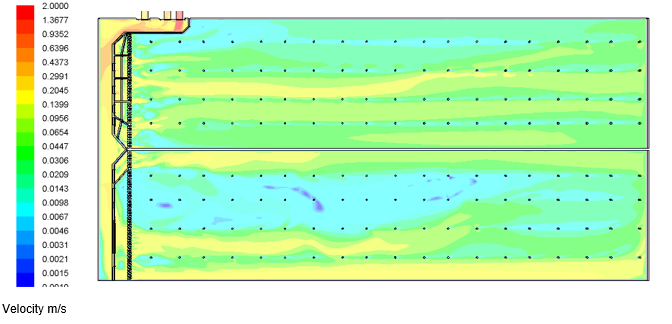
The analysis has shown that the proposed arrangement would provide good hydraulic efficiency at an inflow of 175 MLD with some deterioration evident at the maximum design flow of 220 MLD.
In addition the CT value was determined. CT values of 49.2 mg min/l and 36.6 mg min/l were calculated for inflows of 175 MLD and 220 MLD respectively.
Phase Three Development
Phase Three development option is similar to Phase One development with a manifold constructed outside the tank with two new inlet pipes entering through the West wall. The inlet pipes would deliver flow into the existing inlet channel and upstream of the existing inlet baffle arrangement which would be retained. However, under the Phase Three development option the length of the curtain walls would be extended.
The model was run at a flow of 220 MLD with the hydraulic efficiency determined, see the table below.
|
North and South Basins - Flow 220 MLD – Tracer released at channel inlet – volume analyzed 5805 m3 |
||||
|
TTDT (hours) |
T10 (hours) |
T90 (hours) |
Baffle factor (BF) |
Morrill Index (MI) |
|
0.63 |
0.46 |
0.84 |
0.73 |
1.83 |
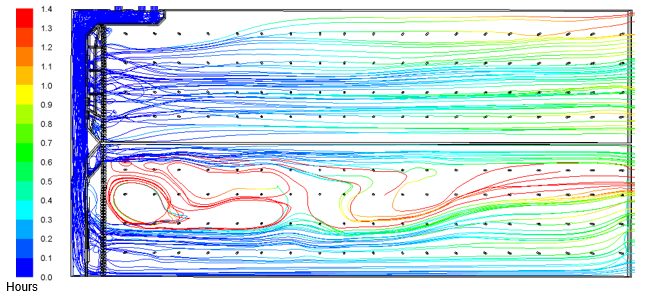
The analysis has shown that the proposed arrangement would provide quite good hydraulic efficiency at an inflow of 220 MLD. However, there was a persistent low velocity area in the North Tank at the end of the last lane adjacent to the existing inlet apron. This failed to clear even after a period of two hours.
In addition the CT value was determined. A CT value of 49.7 was calculated for an inflow of 220 MLD.
Moorfield Estate
Yeadon
Leeds LS19 7YA
e: info@hydrotecltd.co.uk
w: hydrotecltd.co.uk

